Hi.
We make complex information and data tangible, understandable, and explorable, with whatever tools or means necessary.From annual reports to complex workflows or processes, charts, or interactive data exploration tools, anything is possible.
Email me at jan@tastbaar.studio
Call me at 0493712366
CV
Linkedin
Notice
This is how the last visitor organised the website.
Feel free to re-organise. Hit SAVE if you feel like you've improved it.
Data icon
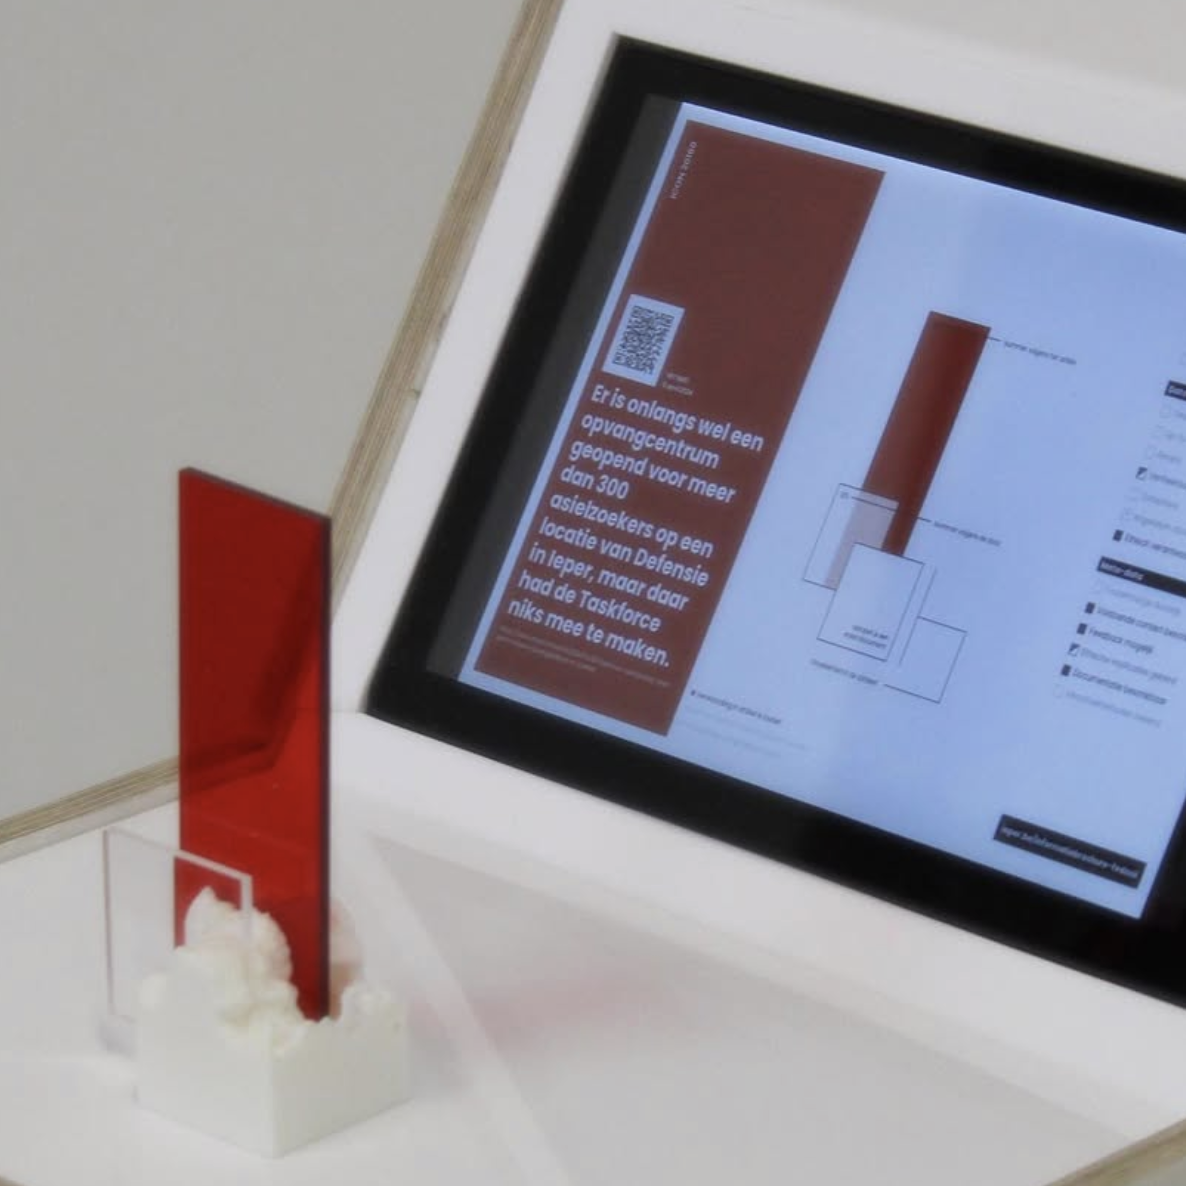
The Data Icon project evaluates factual information in media, displaying the found data sources, alongside reported numbers with regards to their context. It offers a tangible way to explore data discrepancies in mainstream reporting.
READ MOREWorld Function Collapse
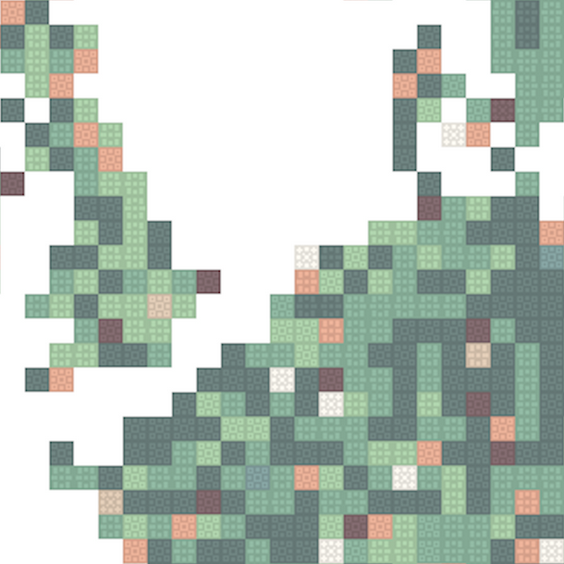
World Function Collapse is an explorable print containing data from the European Space Agency, to visualize shifts in land coverage across the world.
READ MOREThomas More - Modemonitor
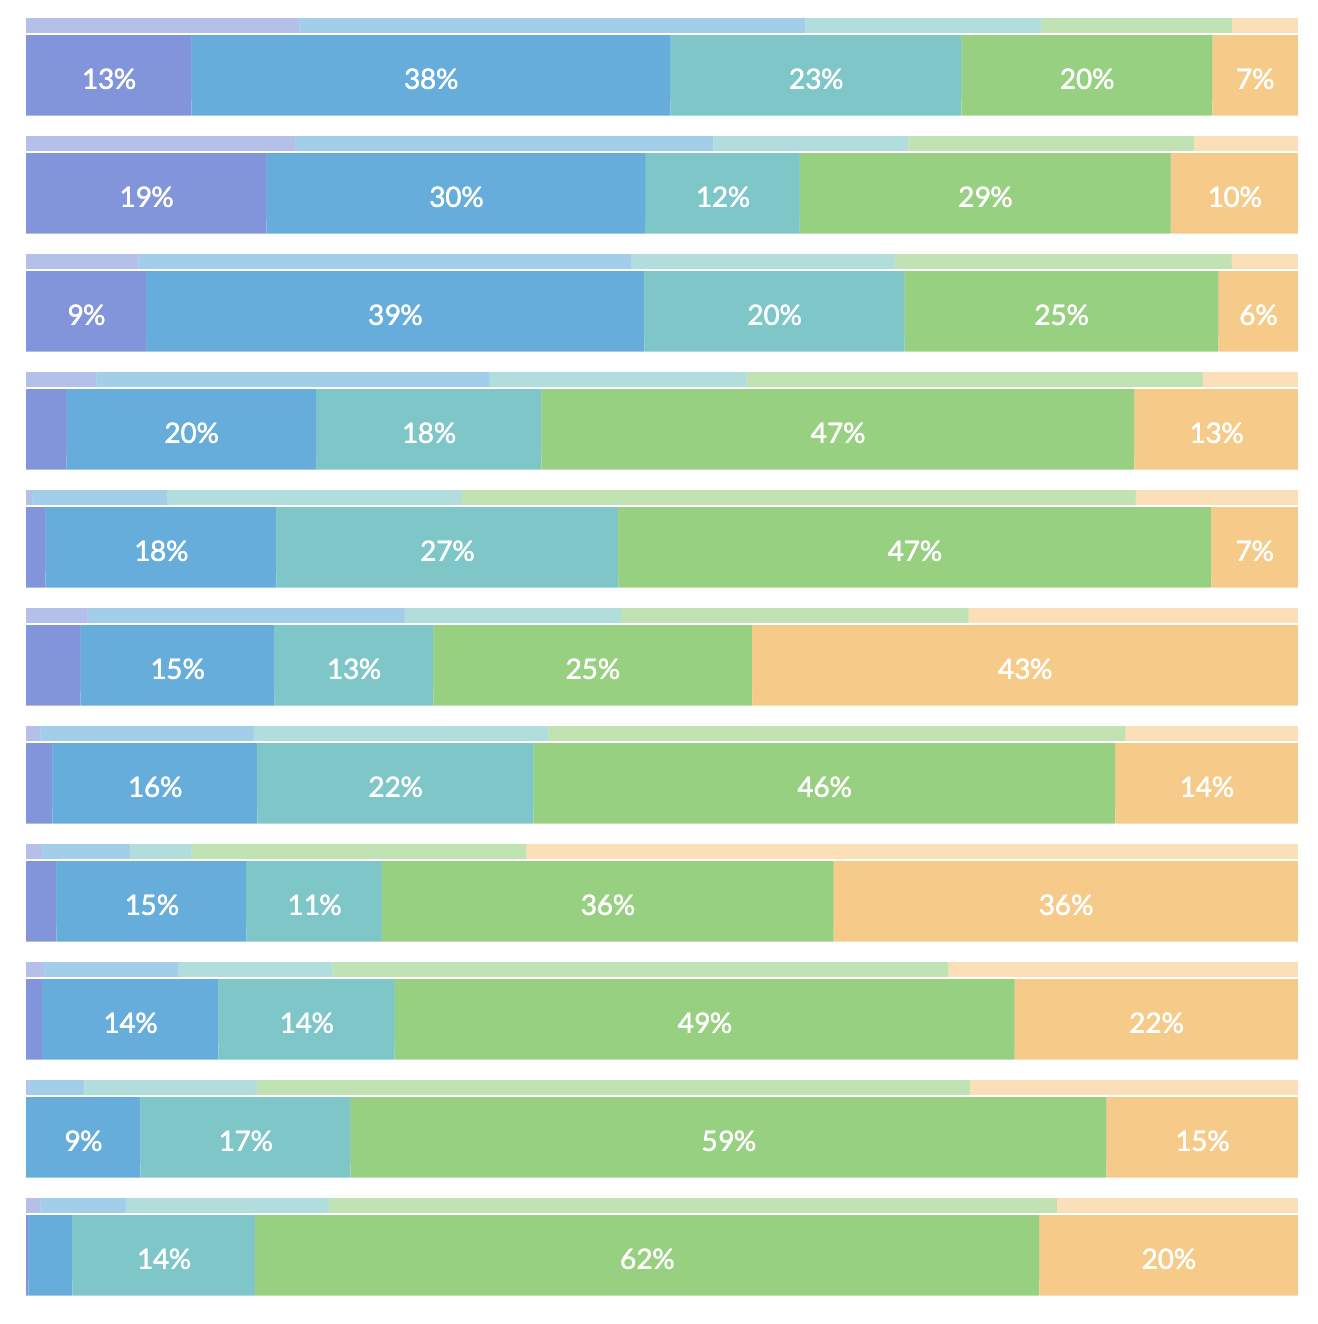
A tool to display the findings of fashion research data to shop owners. Visitors can filter and find relevant metrics and graphs.
READ MOREWritings on the wall
Processing and visualisation of 4 years worth of discussions in the flemish parliament.
READ MORENotice
Visit the desktop version of this website to play with the layout.